Electric Vehicles and Power Electronics: An Industry Report for Non-Specialists
EV power electronics market: how vehicle sales, semiconductor content per car and the value of the power devices fit together, and which numbers are comparable.
Updated: October 27, 2026
Read EV power-electronics demand as a planning input for topology and capacity—not as a precise forecast you can enter into an MRP system. Third-party market figures vary by scope; translate them into engineering actions: voltage class mix, package capacity, and lead-time risk.
For device-level follow-ups see power semiconductor market outlook 2026–2030 and silicon carbide market 2026.
| Market signal | Engineering response | Do not |
|---|---|---|
| Demand growth in a segment | Stress-test second sources and MoQ | Scale unique MPNs prematurely |
| Shift to higher V / WBG | Revisit derating and gate-drive | Copy Si designs unchanged |
| Regional capacity headlines | Map real lead times by package | Treat press CAGR as bookings |
| Efficiency regulation pressure | Budget conduction + switching loss | Optimize only sticker VF |
How to read EV numbers
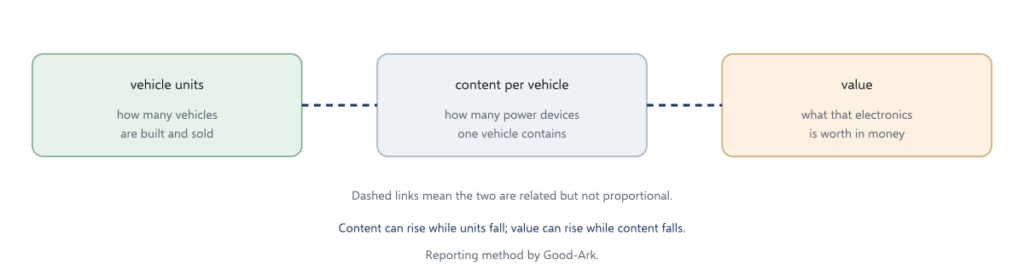
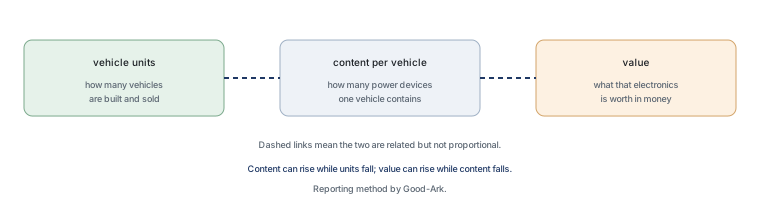
Start by asking what is being counted. A unit figure tells you how many vehicles were produced or sold. A content figure tells you how much electronics a typical vehicle of a given type carries. A value figure tells you what that electronics was worth. Production and sales also differ, because vehicles are built and then shipped, and inventory between the two can move a quarter’s numbers without any change in demand.
It is also worth separating the vehicle categories, because a battery-electric car, a plug-in hybrid and a mild hybrid have different power electronics and are frequently grouped together in a single percentage. A growth figure for “electrified vehicles” therefore describes a wider set than a growth figure for battery-electric cars, and the two can move in different directions.
Vehicle sales versus semiconductor content
The second link in the chain is content per vehicle, and it is the reason this subject is interesting rather than merely cyclical. A vehicle with an electric drivetrain needs power devices to convert battery voltage to motor current, to charge the battery from the grid, to run the auxiliary systems and to protect every one of those circuits. A vehicle with a conventional drivetrain needs a much smaller set.
That means device demand can rise while vehicle production is flat, because the mix is shifting towards vehicles with more electronics. It also means the direction reverses: a fall in total production can outweigh a rise in content per vehicle, and both statements can appear in the same week without contradicting each other. The comparison that helps is a recipe that gets richer while fewer dinners are cooked.
Where the power devices sit
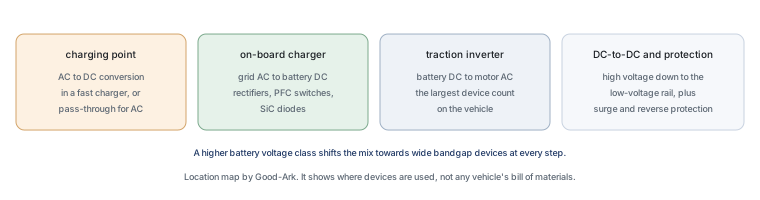
Four locations account for most of the power semiconductor content. The traction inverter converts direct current from the battery into the alternating current the motor needs, and it is usually the largest single consumer of power devices on the vehicle. The on-board charger converts alternating current from a charging point into the direct current the battery needs. The DC-to-DC converter steps the high battery voltage down to the low voltage used by control electronics and lighting. And every one of those circuits is surrounded by protection devices that clamp surges and transients.
| Location | Job | Typical devices |
|---|---|---|
| Traction inverter | Battery DC to motor AC | IGBTs or SiC MOSFETs, gate drivers, protection diodes |
| On-board charger | Grid AC to battery DC | Rectifiers, power factor correction switches, SiC diodes and MOSFETs |
| DC-to-DC converter | High-voltage battery to low-voltage rail | Power MOSFETs, rectifiers, controllers |
| Protection and auxiliaries | Clamping, reverse protection, load switching | Transient suppressors, Zener diodes, small power MOSFETs |
Voltage platforms and their effect on part mix
The battery voltage class shapes which devices are suitable, and this is a technical relationship rather than a market preference. A 400 V class pack gives the designer one set of options; an 800 V class pack allows the same power to be delivered at half the current, which reduces the copper cross-section, the cable weight and the resistive losses in the wiring. The cost is that the devices must block a higher voltage, and that every insulation and creepage requirement becomes stricter.
Higher blocking voltage favours a different device mix. Silicon insulated-gate bipolar transistors are widely used at the lower voltage class because they are robust and inexpensive at moderate switching frequencies. Moving to the higher class increases the benefit of silicon carbide metal-oxide-semiconductor field-effect transistors, whose lower switching loss allows the converter to run at a higher frequency with a smaller magnetic component.
Charging infrastructure demand
Charging adds a second set of power electronics that lives outside the vehicle. A direct-current fast charger contains an alternating-to-direct converter that performs most of the same functions as an on-board charger, only at a much higher power level, and it therefore uses more and larger power devices per unit. Alternating-current charging points use less power electronics and rely on the vehicle’s on-board charger instead.
The consequence for a component buyer is that the two segments have different part profiles and different qualification expectations. A charger installed outdoors also has to survive temperature cycling, humidity and pollution, so the protection devices and the enclosure requirements are more demanding than the equivalent function inside a vehicle.
Supply and cost pressure points
Three pressure points appear repeatedly in this chain. The first is qualification: an automotive power device has to be qualified to an automotive standard and to the customer’s own requirements, and that process takes time which cannot be compressed by paying more. The second is the substrate layer for wide bandgap devices, which is the slowest part of the chain to expand. The third is demand concentration, because a small number of large customers place orders that are large enough to consume a supplier’s capacity.
There is also a design-side pressure that buyers should know about. Automotive parts are specified with a safety margin and are often single-sourced at the design stage, which makes a later second source difficult: changing a device means re-qualification. That is why the time to ask about a second source is during design rather than during a shortage.
What the next five years depend on
Four conditions matter more than any forecast. Whether the average battery voltage class continues to rise, because that decides the device mix. Whether charging infrastructure is built at a rate that matches vehicle sales, because a charger contains power electronics of its own. Whether qualification capacity keeps pace, because a qualified part is the only kind that can be shipped. And whether the efficiency rules that apply to vehicles and chargers tighten further, because a rule changes a bill of materials directly.
Sources and caveats
Statements about vehicle markets should be attributed to a source that publishes its method, and the same figure should be checked for whether it counts production, registrations or deliveries. Statements about semiconductor content should say which vehicle category they describe. Statements about device value should say whether they are measured at the device sale or at the vehicle. Where a source does not say, the number is still evidence that a claim was made, and it is not evidence about the world.
There is one more caveat that applies to almost everything in this subject: the figures are revised. Production counts are restated, registration data is corrected after the fact, and a quarterly comparison can change direction once the final numbers are in. A reader who keeps the original figure and the revision side by side learns something about the reporting process as well as about the market, and a reader who treats the first number as final is occasionally surprised by a correction that arrives a month later.
How to use this report without over-fitting
- Separate what is measured (shipments, ASP bands) from what is opinion (CAGR to 2030).
- Map claims to your BOM families: Si Schottky, FRD, MOSFET, IGBT, SiC.
- Prefer dual-source packages over single-source exotic outlines when volumes are uncertain.
FAQ
Are the market size numbers in articles exact?
Treat them as directional unless you have the primary analyst table and identical scope. Definitions of “power semiconductor” differ widely.
What should purchasing do with a bullish forecast?
Negotiate forecast flexibility, not only price. Ask for package-level lead times and PCN policy.
Does AI / EV demand change discrete diode selection?
It raises current density and thermal expectations in adjacent rails (48 V, AUX, sensors). The diode still needs a normal V/I/thermal worksheet.
Where should engineers go next?
Pair this overview with a concrete selection guide such as power MOSFET selection or power rectifier selection.
Continue through this engineering topic
- Power Semiconductor Market Outlook 2026 2030
- Silicon Carbide Market 2026
- Ai Data Centers Power Semiconductor Demand
- Automotive Semiconductor Report 2026
- China Power Semiconductor Industry 2026
- Component Lead Times 2026
Topic hub: Power semiconductor market outlook 2026–2030 — related selection guides and application notes in this cluster.