Power Semiconductor Market Outlook 2026-2030: What Beginners Should Know
Power semiconductor market 2026: there is no single forecast, and that is the useful answer. The four drivers you can verify, and how figures mislead.
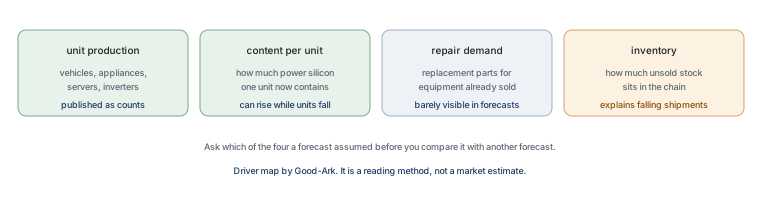
There is no single power semiconductor forecast for 2026, and that is the useful answer rather than an evasion. Demand for power devices follows four things you can actually check: how much equipment is being built, how much semiconductor content each unit contains, how much capacity exists to make the parts, and where the unsold inventory is sitting. Published forecasts disagree mainly because they measure different things. This report sets out what can be verified, what cannot, and how to read a market number without being misled by it.
How to read this report
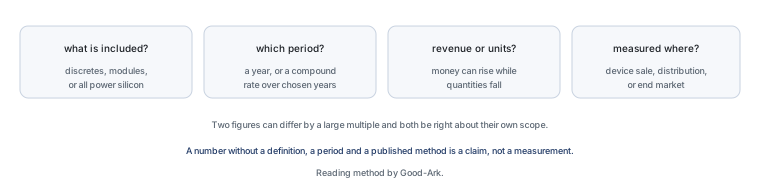
Start with the scope, because most confusion about market figures is a scope disagreement wearing a number. A power semiconductor market can mean discrete devices only, discrete devices plus modules, or everything that handles power including integrated power controllers. It can be measured in revenue or in units. It can cover one region or the world. It can be a historical estimate or a forecast, and a forecast can be stated in nominal or inflation-adjusted currency. Two figures that differ by a factor of two are often both correct about the thing they measure.
This report is a qualitative industry analysis rather than a purchased market study, and it deliberately publishes no market value of its own. Where a quantity appears below it is a technical constant — a bandgap, a voltage class, a temperature — that you can check in a textbook or a datasheet. Where a direction is described, it is described as a condition rather than a prediction, so that you can test it against the data you can see.
What counts as a power semiconductor
A power semiconductor is a device whose job is to control, convert or protect the flow of energy rather than to process information. The distinction is not about the material or the package; it is about the function. A small signal diode and a power rectifier can be the same kind of junction, and they belong to different businesses because one carries information and the other carries current.
The analogy that fits is a building with a computer room and a plant room. The processors, memory and interface chips are the computer room: they handle decisions and data. The rectifiers, MOSFETs, IGBTs, thyristors and protection devices are the plant room: they switch and steer power, and nothing works if they are undersized. Both are semiconductors, both are made in fabs, and they are sold into completely different conversations.
| Family | What it does | Where you meet it |
|---|---|---|
| Rectifier and Schottky diodes | Conducts one way, blocks the other | Every mains-powered product, charger and adapter |
| Zener and transient suppressors | Clamps or limits a voltage | Protection of rails, ports and automotive networks |
| Power MOSFETs | Switches current at high frequency | Switching supplies, motor drives, battery circuits |
| IGBTs | Switches high current at moderate frequency | Motor drives, induction heating, traction |
| Silicon carbide and gallium nitride devices | Switches at higher voltage or higher frequency | EV traction and charging, PV inverters, compact adapters |
| Modules and assemblies | Packages several devices with cooling and control | Traction inverters, utility-scale power conversion |
Demand drivers you can verify
The first driver is the production volume of the equipment the parts go into. Vehicle output, appliance output, server shipments, inverter installations and industrial machinery output are all published as counts by industry bodies and statistical agencies. When someone predicts device demand, the first question to ask is which of those volumes they assumed.
The second is content per unit, which is the number that makes power devices interesting. A car that was mechanically controlled contains a modest number of power devices; the same car with an electrified drivetrain, electric power steering and dozens of switching supplies contains many more. Content per unit can rise while unit volumes fall, which is why a demand forecast has to state both.
The third is replacement and repair demand, which behaves differently from new-production demand and is largely invisible in forecasts. The fourth is inventory, and it is the reason the same end-market data can produce opposite conclusions in two consecutive quarters: if distributors are holding three months of stock, shipment figures fall before consumption does.
Silicon versus wide bandgap split
Silicon remains the material of the overwhelming majority of power devices by volume, and it will stay that way for the parts where its properties are adequate. The technical reason wide bandgap materials matter is measurable: the bandgap of silicon is about 1.1 electronvolts, while that of silicon carbide is roughly three times larger, which allows a device of the same blocking voltage to be made in a much thinner and more lightly doped layer, and therefore with lower conduction loss.
Two consequences follow, and they are the reason the split follows applications rather than fashion. Silicon carbide devices are useful where the voltage is high and the current is large, such as traction inverters and solar conversion. Gallium nitride devices are useful where the frequency is high and the size matters, such as compact power adapters. Elsewhere — rectification at low voltage, protection, signal switching, most consumer supplies — silicon is neither displaced nor likely to be, because the gain from a more expensive material does not exist at those ratings.
Regional supply picture
The structure of the supply chain matters more than any single year’s ranking, and the structure is stable enough to describe. Wafer fabrication clusters where capital, process engineers and a supporting chemical and equipment industry already exist. Assembly and test, which is the back end where a die becomes a package, is more widely distributed and is concentrated in Asia. Substrates for silicon carbide add a third layer, because growing a crystal is a different process from fabricating a device on it.
The visible change over the past several years is the addition of mature-node and power-device capacity in more places, driven by policy support and by buyers who want a second source in a different country. That expansion changes the geography of supply without necessarily changing the technology. For a buyer the practical consequence is not a ranking but a question: how many independent sources exist for the part I need, and are they in more than one country?
Price and capacity cycles
Power semiconductor prices move in a cycle that has a simple cause. Capacity is added in large blocks and takes years to build, while demand can change in a quarter. When demand rises faster than capacity, lead times extend and prices firm. When the new capacity arrives into a softer market, the reverse happens and prices fall.
The comparison to a hotel is close enough to be useful. Rooms cannot be added overnight, so in a busy week prices rise and travellers change plans; two years later, when the new wing opens in a quiet season, rooms are discounted. Neither outcome says anything about whether travel is growing. In the same way, an extended lead time is evidence about capacity relative to demand, not a verdict on an industry’s future.
What the forecasts disagree about
Four disagreements account for most of the spread between published figures. The first is what the word power includes, which can change a market by a large multiple. The second is the period: a calendar-year estimate, a fiscal-year estimate and a five-year compound growth rate are three different statements, and a compound rate is extremely sensitive to which years are chosen as the ends of the range.
The third is currency and inflation, because a revenue figure can rise while the quantity shipped falls. The fourth is who is counting: a company that sells the device, a distributor that sells it again and a researcher who estimates the end market may be measuring the same demand at three different points in the chain.
There is also a practical warning about search results. For this topic the first page is dominated by forum threads, press-release aggregations and index pages rather than primary data, which means a search engine summary of “the market” may be summarising a summary. When a number appears without a definition, a period and a source that publishes its method, treat it as a signal about what people say rather than as evidence about what is happening.
What to watch next year
Watch your own lead times first, because they are the one indicator you can observe continuously and they respond before published statistics. Then watch capacity announcements for the packages you buy, because a new line takes years to matter. Watch distributor inventory for the same family, because it explains shipment figures that seem disconnected from demand. And watch regulation that changes what equipment is allowed to consume, because an efficiency rule can change a bill of materials faster than any demand forecast.
FAQ
What is the forecast for the power semiconductor market in 2026?
There is no single forecast, because published figures use different scopes. What can be said without inventing a number is that demand for power devices tracks equipment production, semiconductor content per unit, repair demand and inventory, and that content per unit has been rising in electrified products. Any specific figure should be read with its scope, period, currency and method attached.
Will there be a semiconductor shortage in 2026?
Shortages are device-specific rather than industry-wide most of the time. They appear when a single family or package becomes the constraint while capacity is being added elsewhere, and they show up first as extended lead times for particular part numbers rather than as a headline. The indicator to watch is the lead time quoted for the parts you actually buy.
Are semiconductor prices expected to rise?
Prices in this category move with the capacity cycle: when demand runs ahead of capacity, lead times extend and prices firm, and when new capacity arrives into a softer market they weaken. That is a mechanism rather than a prediction. Industry-wide price forecasts are also sensitive to scope, because a mix shift towards higher-value devices raises average revenue per unit without any device becoming more expensive.
Is the semiconductor industry declining?
The industry as a whole is cyclical rather than declining, and the two halves of its revenue behave differently: logic and memory follow computing demand, while power and analogue devices follow equipment production and electrification. A quarter of falling revenue in one segment is usually a statement about inventory, not about the end of a market.
What to do next
Take the next market figure you read and apply the four filters above: scope, period, unit and measurement point. That habit costs nothing and prevents most of the misreading. For readers who want the technology behind the split between silicon and the wide bandgap materials, our overview of discrete power devices and the silicon carbide device families are the natural next steps.
Sector-level material is published by the Semiconductor Industry Association, statistical background by NIST, energy statistics by the US Department of Energy, standards for devices by JEDEC, international electrotechnical standards by IEC, and quality management requirements by ISO.
Tell Good-Ark the part number and the volume you plan, and we will tell you the current lead time and the packing unit, which is the local version of the same question.
Email sales@goodark.com, or start from the sourcing strategy guide.
This article is published by Good-Ark, a manufacturer of discrete semiconductor devices. It is a qualitative industry analysis and publishes no market value, growth rate or share estimate of its own; the quantities used are technical constants, not measurements of a market.
Recommended
 Why Do Diodes Get Hot? Conduction and Switching Losses ExplainedInfoStandard, Fast Recovery, and Schottky Diodes: What’s the Difference?Info
 What Is a Fast Recovery Diode? Understanding “Fast Recovery”Info
 What Is a Diode? A Beginner’s Guide to How It WorksInfo
 Automotive Semiconductor Report 2026: Chips Per Car Keep RisingKnowledge